Posted by coljac in Astrophysics | 2 Comments
The things you find
My project involves looking at images – lots of images. Not thousands, but hundreds of millions, so it’s lucky I have a computer to look through them for me. Getting it to do its job well is the goal of my research.
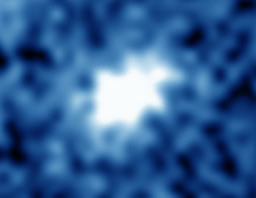
When astronomers work with image data they generally aren’t talking about jpegs or pngs. Professional astronomy left looking into eyepieces behind long ago and is now all about collecting data with the most sensitive instruments modern engineering can devise. When you think of an astronomical image you might imagine something like a giant wallpaper-quality picture of a galaxy, but a more scientifically cutting-edge galaxy might look more like this:

Galaxy at redshift 7. Source: SUBARU/David Sobral et al.
This is because a lot of the most interesting science is happening right on the edge of what we can detect, which in astronomy often means the furthest back in time that we can possibly see. At the edge, every bit of light you can measure is important, right down to the individual photon. In practice, an astronomical image taken from the instrument is usually distributed as a ‘FITS’ file which includes all sorts of metadata about where on the sky it’s looking, what filters are in place and the peculiarities of the instrument it was taken on. The data in the file is likely to be the actual count of electrons picked up by the detector, but if you are lucky it might be converted to flux values – the amount of energy detected per second per unit area. As you can imagine, the constraints are a little different when you are taking a picture of the sunset on an iPhone.
As you may know, when we look at an image on the screen and see colours we are seeing a mixture of red, green and blue channels of different brightnesses. Where the blue channel is bright and the others dim, we see blue, of course; but where they are all equally bright we see white or grey. Here again astronomical imaging is a little different. Astronomy is less concerned with what people can see and more with understanding the physical processes happening, so light is collected at all sorts of different wavelengths depending on the instrument and the nature of the investigation. This could mean radio waves, infra red, visible light, UV or even gamma rays to name a few. To make a colour image we can look at on a screen, you need red, green and blue channels; but which band (range of wavelengths) you use for each is up to you, and might not necessarily be what you think of as red, green and blue light if it includes, say, infra-red or ultra-violent information.
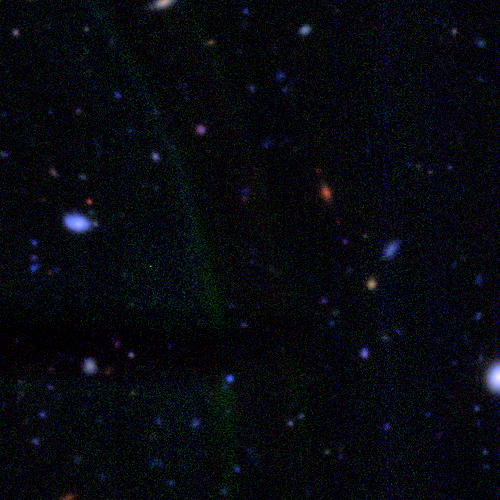
So, yesterday I was producing some colour images at random from the fields I was looking at while debugging a problem with a missing red band. Out of five different colour bands available, I was choosing three (g, r and i or y) to make colour images for testing, but some were coming out all blue (meaning the red channel was probably missing). Most of my little random images look like this – a smattering of fuzzy distant galaxies, many at the edge of what can be detected by this telescope:

A random piece of sky
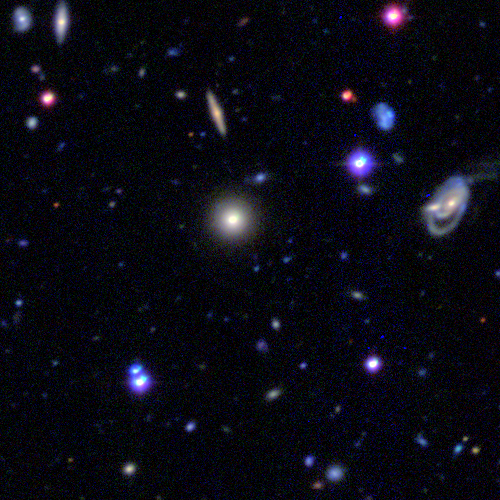
Some have slightly more going on, like this patch – a bright elliptical galaxy in the centre, a handful of stars and at least a few spiral galaxies :

A busier piece of random sky
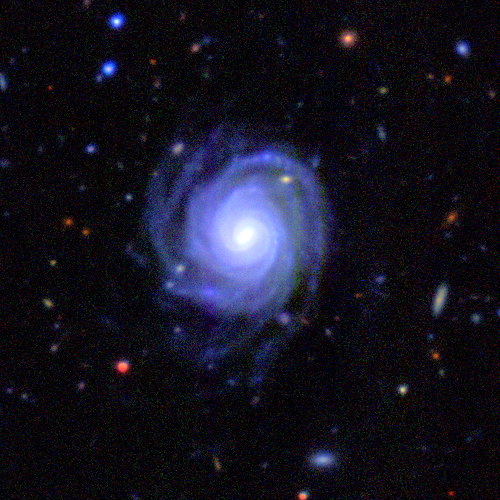
And then this guy wandered into my field of view.

Not only is it a beautiful sight, but that spiral galaxy helps put the other images in context. Almost everything we’re looking at there is a galaxy, they are just very far away. With this galaxy hovering in the foreground, it adds some perspective to those other images on the celestial sphere so far away in distant time and space.

Have you a way of estimating how many ly distance from ‘us’ ?
Yes, I do! There is a photometric redshift catalog for the survey, which is a way of saying there’s an automated way of guessing from the galaxy’s light in different colours.
For that galaxy, it looks like the redshift is about 0.13, or roughly 1.6 billion light years away. That light we see is quite old.